
Self-Organized Criticality : The Math and Physics of Disasters
How Per Bak Explains Why Bad Things Happen

"Buckle up. This isn't your average blog post. It's a deep dive into the mind of a physicist who dared to ask,
'Why is the world always on the brink of falling apart...yet never quite does?'
Per Bak's answer – 'self-organized criticality' – rocked my world..'.
Now, I'm about to rock yours. I dog-eared several pages (in 2023) of How Nature Works: the science of self-organized criticality, scribbled notes, let my mind go astray until I grasped some part of it. This isn't just another long form blog post – it's your invitation to join me down the unsettling rabbit hole.
Fair warning: this stuff is dense, so be patient, let it sink in.
My goal? To make you a little uncomfortable, perturb your worldview, and trigger you to explore territory you might have skipped, to the otherwise mundane and trending topics. No 'likes' needed, just an open mind for how this crazy concept applies to EVERYTHING from earthquakes to stock markets. Ready to have your reality gently shaken?"
“Equilibrium is death. Change is catastrophic. We must adapt because we can’t predict.” ~ Per Bak
The Beachcomber's Paradox: A Lesson in Unpredictable Chaos, From Sandcastles to Stock Prices

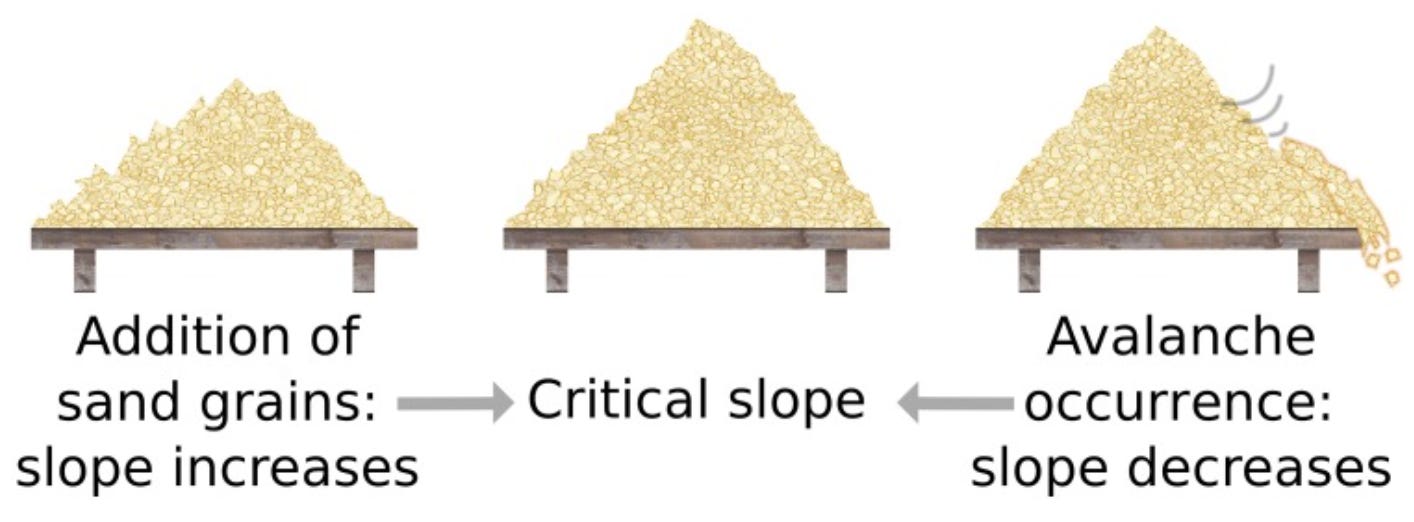
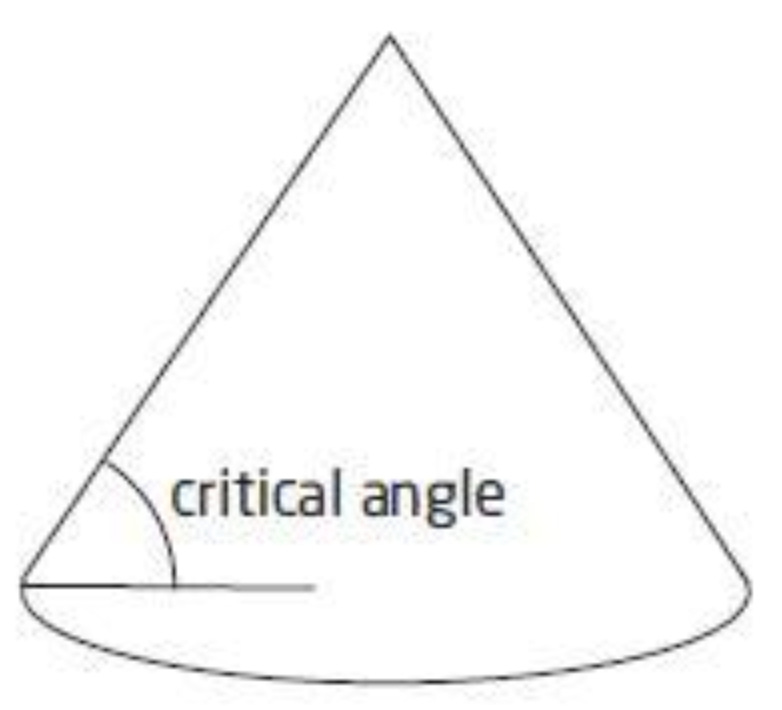
Picture this: a lone beachcomber, bucket in hand, methodically pouring sand onto a sunny stretch of beach. Grain by grain, a cone-shaped pile rises, growing taller and steeper with each deposit. It's a simple, almost meditative act...until it's not.
The Unseen Tipping Point
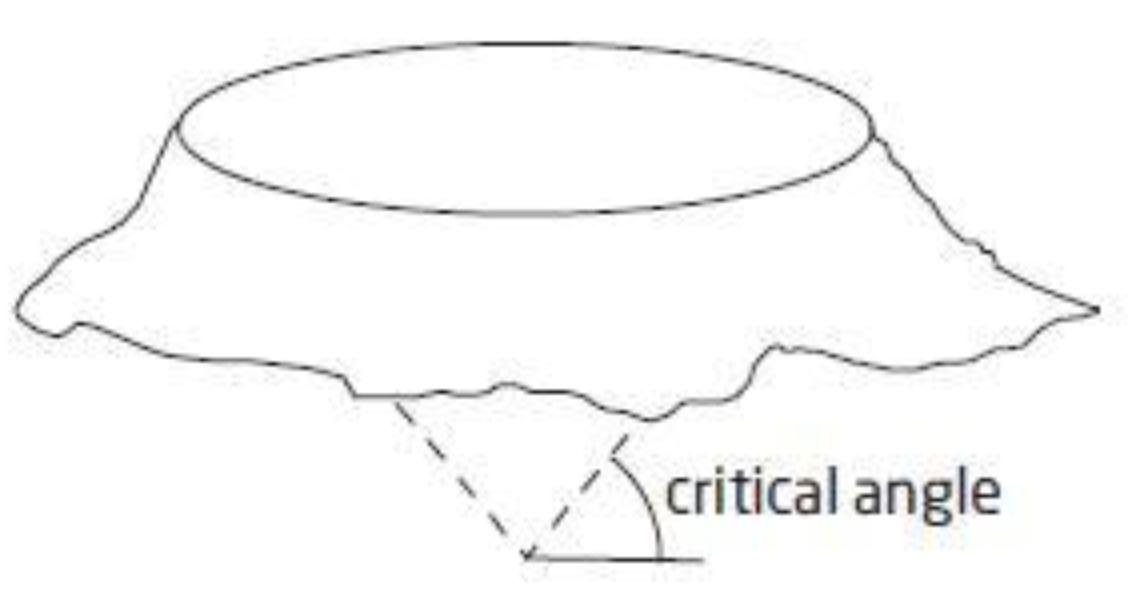
Suddenly, with no warning, a chunk of sand breaks away. It tumbles down the slope, leaving a miniature avalanche in its wake. The beachcomber, unfazed, resumes their task. But the cycle repeats – slow, deliberate building followed by abrupt, unpredictable collapse.
What's happening here is far more profound than child's play. The sandpile, in its deceptive simplicity, is a microcosm of complexity. It's a "simple-but-complex" system, where countless individual grains interact to create behavior that's impossible to predict. Each added grain nudges the pile closer to an unseen tipping point – a state of precarious balance that Bak called "self-organized criticality" (SOC).
This tipping point isn't just for sand piles. Imagine a publicly traded software company, a giant built on several product lines and fueled by the whims of the stock market. Every quarterly earnings report, every product launch, every whisper of industry gossip is like a grain of sand added to the pile. The company's valuation soars, seemingly unstoppable...until it isn't.
One disappointing financial report, a security breach, or a competitor's breakthrough can send the stock tumbling. Investors panic, analysts downgrade their ratings, and the company's carefully constructed image begins to crumble. The very forces that propelled its rise can now accelerate its fall.
The Physics of Avalanche: Embracing the Upside-Down World of Per Bak
In the late 1980s, three physicists – Per Bak, Chao Tang, and Kurt Wiesenfeld – captured this phenomenon in a computer model. They dubbed it the "sandpile experiment," and it would become a cornerstone of complexity science.
Per Bak, a physicist with a penchant for provocation, dared to ask a question that turned conventional wisdom on its head:
Instead of treating catastrophes as outliers, why not treat catastrophes as the norm, and stability as the outlier? … read this sentence again and let the inversion settle !
In Bak’s universe, everyday stability is simply the prelude to the main event—unexpected and extreme collapse. Only through collapses and catastrophes does the world evolve.
Life is a series of passages from catastrophe to catastrophe with inconsequential periods of calm in between. We need to learn to navigate stormy seas, because they are the new normal.
Bak's Sandpile, a computer simulation of a seemingly simple system, became a metaphor for this radical idea. Each grain of sand, like a tiny unit of change, nudges the system closer to a critical threshold. In this state, a single grain can trigger an avalanche of any size, from a minor slip to a catastrophic collapse. The sandpile, Bak argued, is a microcosm of the complex systems that surround us.
The sandpile isn't just about sand; it's a lens through which to view the unpredictable rhythms of the universe. Earthquakes, financial meltdowns, ecological disruptions – these aren't "black swan" events, but expressions of a deeper pattern. The world, Bak posited, is not in equilibrium; it's constantly teetering on the brink.
This is a profoundly unsettling notion. It challenges our innate desire for order and control. But it also offers a liberating perspective. If we accept that catastrophe is inevitable, we can shift our focus from prevention to mitigation. We can't stop earthquakes, but we can design buildings to withstand them. We can't prevent market crashes, but we can diversify our portfolios.
In Bak's view, the world isn't a serene landscape, but a turbulent sea of constant flux. This isn't necessarily a bad thing. It's these very fluctuations, these upheavals and collapses, that drive innovation and progress. Think of evolution – it's not a smooth ascent, but a series of extinctions and adaptations, each catastrophe paving the way for new forms of life.
From Sandcastles to Stock Markets
But this isn't just about sand or software stocks. The principles of SOC extend far beyond the beach, echoing through the complex systems that shape our world:
Earthquakes: The slow buildup of tectonic stress, culminating in a sudden, devastating release.
Financial Markets: The gradual accumulation of risk, leading to a market crash that seemingly comes out of nowhere.
Forest Fires: The steady accumulation of dry tinder, waiting for a spark to ignite a raging inferno.
Even the delicate balance of ecosystems, the ebb and flow of political unrest, and the unpredictable spread of viral trends can be viewed through this lens.
The Sandcastle Computer: A Digital Playground for Chaos Theory
Forget the beach – the real fun with sand piles was happening inside a computer. Bak, Tang, and Wiesenfeld (let's call them the "BTW crew") weren't building sandcastles on the shore; they were building a virtual sandpile in code, a digital playground for exploring chaos.
Think of it like a giant chessboard, each square a tiny plot of virtual land ready to receive a digital "grain of sand." These grains rained down randomly, filling each square until it reached its limit – let's say, four grains. Then, like an overstuffed Jenga tower, the square would topple, spilling its grains onto its neighbors. Sometimes, this triggered a chain reaction – a cascade of toppling squares that swept across the digital landscape like an avalanche and creating a tapestry of cones and craters.
Now, here's the kicker: these avalanches weren't random. By tracking their size and frequency, the BTW crew discovered a hidden pattern.
Small avalanches were common, medium ones less so, and massive ones were rare. But it wasn't just random luck; it was a precise mathematical relationship called a power law.
Power laws are very common in the real world. In fact, they have many names. Zipf’s Law, Pareto’s Law, scale-free, fractal, and self-similar systems are a few other names given to the mathematical model describing the same phenomenon
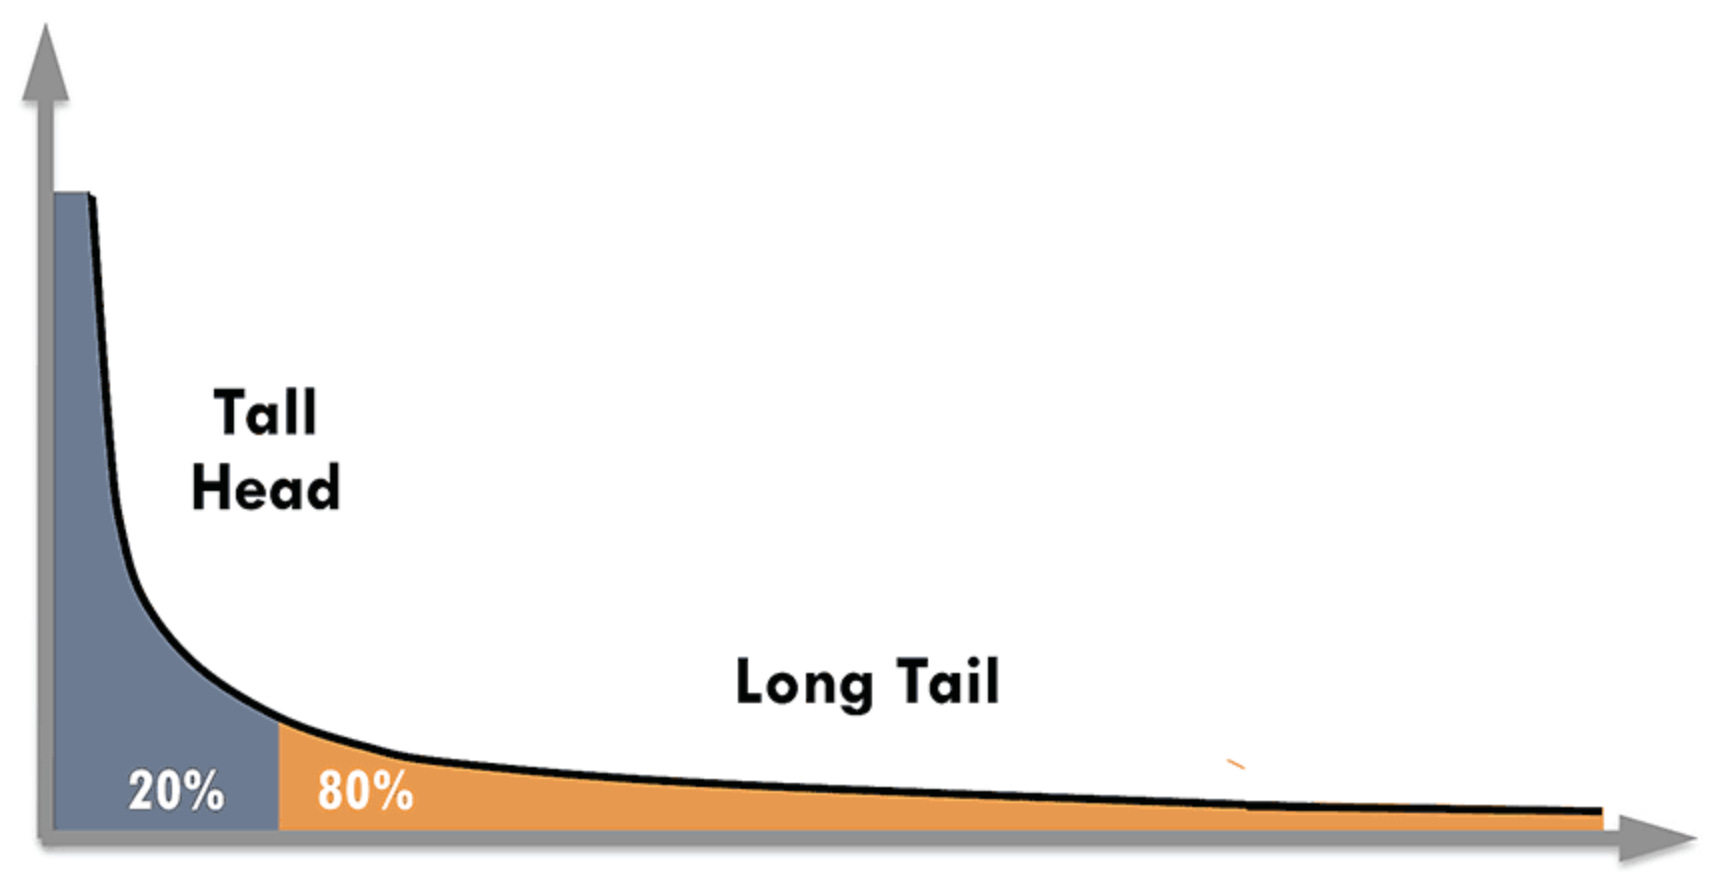
Imagine a graph where the x-axis represents avalanche size, and the y-axis represents how often that size occurs. An interesting thing about power laws is that they are not Bell-shaped Normal Distributions, the staple of any introduction to statistics and probability. A power law would look like a gracefully sloping curve, indicating that as avalanches get bigger, they become exponentially rarer. But crucially, there's always a chance, however slim, of a truly monstrous avalanche – one that could wipe out the entire digital landscape.
Bak wasn’t an insurance actuary, so he characterized exceedence probability in terms that a physicist understands. However, if we consider the insurance industry, when comes to extreme events that they can’t factor in to pricing, savings, liquidity, etc. they “lawyer up” — they ensure their contracts make exceptions or special previsions for the most exceptional circumstances to protect themselves from going out of business. They “clip the tail” off the distribution, so to speak, so that they minimize the risk of being ruined.
The sandpile computer wasn't just a toy – it was a revelation. It showed that even simple systems, governed by straightforward rules, could give rise to complex, unpredictable behavior. The “BTW model” captured the essence of self-organized criticality, that tantalizing state where systems teeter on the brink of chaos, constantly flirting with collapse but never quite succumbing.
It also ignited a scientific firestorm. Researchers began applying the sandpile model to everything from earthquakes and forest fires to stock market crashes and even wars. Could this simple model, born from virtual grains of sand, hold the key to understanding the unpredictable rhythms of our world?
The Sandpile's Secret Language: Deciphering the Patterns of Disaster
Picture this: You're a detective, not at a crime scene, but at a beach. Your "victim"? A sandpile. You observe its individual grains tumbling down in random avalanches. It's chaos, right?
The Plot Thickens: Unpredictable, Yet Predictable
Not quite. Zoom out. Look at the bigger picture, the entire sandpile. A pattern emerges. Small avalanches are frequent, medium ones less so, and massive collapses rare. You can't predict the exact moment or size of the next tumble, but over time, a clear trend emerges.
Think of it like traffic accidents. We can't know who will crash tomorrow, but we know roughly how many will. This is the essence of the "exceedence probability curve" – a tool that lets us see the odds of events happening, even if we can't pinpoint the specifics.
The Exceedence Probability Curve: A Risk Map
Imagine this curve as a map of possible events, where the X-axis shows the size of the event (tiny avalanche to catastrophic collapse), and the Y-axis shows the probability of it happening (high chance to incredibly rare). For our sandpile, the curve slopes downward: small slips are common, giant disasters are outliers.
This curve isn't just for sand. It describes all sorts of unpredictable systems: earthquakes, market crashes, even power outages. Each system has its own curve, each with a different slope, telling us how "risky" it is.
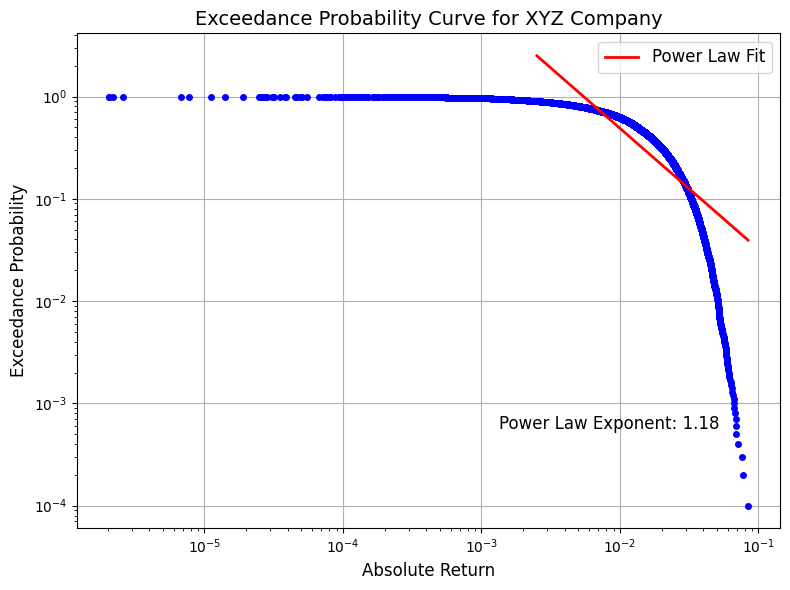
Simulating an Exceedence Probability Curve (of a fictitious publicly trading company) - check code here
Power Laws: The Math Behind the Mystery
Mathematically, this curve often follows a power law – a relationship where small events are vastly more common than large ones. It's like the 80/20 rule on steroids.
Imagine popularity of pop songs: a few chart-toppers, many mediocre hits, a vast sea of forgotten tunes. This isn't random; it's a power law in action.
Why Should You Care?
Exceedence curves and power laws are more than just math tricks. They're tools for understanding risk. They help us:
Prepare: Engineers use them to design buildings that can withstand likely earthquake magnitudes.
Predict: Insurance companies use them to set premiums based on the odds of different types of disasters.
Adapt: By understanding the patterns of chaos, we can build more resilient systems, from power grids to financial markets.
Detecting the Sandpile's Whisper: Self-Organized Criticality in the Tech World
Behind the Scenes at a Venture-Backed Startup
As a product manager at a high-growth startup, her days are a whirlwind of feature launches, customer feedback, and investor meetings. It's exhilarating, but there's an underlying tension, a sense that we're constantly balancing on a knife's edge.
Our team is small, agile, and driven. Every decision, every line of code, is like a grain of sand added to the proverbial pile. We celebrate wins, big and small, but we also know that one misstep could trigger a chain reaction. A buggy release, a competitor's surprise move, a negative review from a key influencer – any of these could snowball into a crisis.
To gauge our proximity to criticality, we meticulously track key metrics:
Customer Satisfaction: We monitor Net Promoter Scores (NPS), customer support ticket volume, and social media sentiment. A sudden drop in any of these could signal a looming avalanche of negative feedback.
User Engagement: Daily active users, session length, and feature adoption rates are vital indicators. A significant decline could point to waning interest and potential churn.
Financial Health: Burn rate, runway, and cash flow are our lifelines. Fluctuations in these metrics can reveal underlying vulnerabilities that could quickly escalate.
We're a system on the brink, constantly adapting, evolving, and pushing the boundaries. The energy is palpable, but so is the risk.
The Boardroom View of a Public Tech Giant
In contrast, my friend, a board member at a publicly traded tech behemoth, sees a different kind of sandpile. Their company is massive, with thousands of employees and a global customer base. The stakes are higher, the consequences of failure more severe.
But even here, self-organized criticality is at play. The quarterly earnings cycle is like a metronome, ticking off the company's progress against investor expectations. A slight miss on revenue targets, a hint of slowing growth, can send shockwaves through the market, causing stock prices to plummet and investor confidence to waver.
My friend describes the boardroom as a theater of tension and anticipation. Every decision is scrutinized, every risk assessed, yet there's always the nagging fear of the unknown. The company, despite its size and resources, is not immune to the cascading effects of unforeseen events – a cyberattack, a regulatory change, a global pandemic.
The sandpile metaphor holds true even at this scale. The company's vast infrastructure, its intricate web of dependencies, makes it vulnerable to shocks that can propagate rapidly and unpredictably.
Embracing the Avalanche
Both the startup and the tech giant are playing the same high-stakes game, albeit on different stages. They've both reached a critical state, where even minor disruptions can have outsized consequences.
But this isn't a reason for despair. It's a call to action. By understanding the principles of self-organized criticality, companies can learn to anticipate, adapt, and even thrive in the face of uncertainty.
For the startup, this means building in redundancy, fostering a culture of rapid experimentation, and constantly monitoring the signals of impending change. For the public company, it means diversifying risk, investing in robust cybersecurity, and cultivating a workforce that's agile and resilient.
In both cases, it's about embracing the avalanche – not as a disaster to be avoided, but as a natural part of the landscape. By learning to navigate the unpredictable terrain of self-organized criticality, companies can unlock their full potential and create a future that's not just sustainable, but truly thriving.
Risk in the Rearview Mirror: Exceedence Curves as a Guide to the Future
Exceedence probability curves can indeed be valuable tools for both venture-backed startups and publicly traded tech giants, provided they understand how to interpret the data and connect it to the principles of self-organized criticality. Here's how:
Venture-Backed Startup:
Customer Satisfaction Exceedence Curve: By plotting customer satisfaction scores (e.g., NPS) against their frequency, the startup can see how often it faces varying levels of dissatisfaction. A steep curve indicates that most customers are happy, while a shallow curve suggests a higher risk of widespread dissatisfaction leading to churn. This helps prioritize customer support and product improvements.
Feature Adoption Exceedence Curve: This curve can reveal how many users adopt new features. If the curve is steep, it implies that most users adopt quickly, indicating good product-market fit. A shallow curve suggests slower adoption, potentially signaling the need for more onboarding or feature refinement.
Financial Risk Exceedence Curve: By analyzing historical financial data (e.g., monthly revenue, burn rate), the startup can estimate the probability of exceeding various loss thresholds. This helps assess financial risk and make informed decisions about fundraising and spending.
Publicly Traded Tech Giant:
Stock Price Volatility Exceedence Curve: By plotting daily stock price changes (or volatility) against their frequency, the company can visualize the likelihood of extreme price movements. A steep curve suggests relative stability, while a shallow curve indicates a higher risk of sudden, significant drops. This aids in risk management and investor communication.
Social Sentiment Exceedence Curve: Analyzing social media sentiment scores (positive, negative, neutral) can reveal how often the company faces public backlash. A steep curve indicates mostly positive sentiment, while a shallow curve suggests a higher risk of PR crises or negative brand perception. This helps gauge reputational risk.
Cybersecurity Incident Exceedence Curve: By tracking the frequency and severity of past cybersecurity incidents, the company can estimate the probability of future breaches. This helps allocate resources to security measures and create contingency plans for potential attacks.
Common Ground:
Both types of companies can leverage exceedence curves to:
Identify Critical Thresholds: By understanding the shape of the curve, they can pinpoint the points at which the system becomes most vulnerable to cascading effects.
Assess Risk: The curves provide a visual representation of the probabilities associated with different magnitudes of events, aiding in risk assessment and decision-making.
Prioritize Mitigation: By focusing on the areas of the curve where the probability of large events increases most rapidly, companies can prioritize resources and interventions to reduce overall risk.
Monitor Early Warning Signals: Subtle shifts in the curve's shape or sudden increases in the frequency of small events can act as early warning signals of impending larger-scale events, allowing for proactive responses.
Jonathan Callan: Sculpting the Geometry of Chaos
Artist Jonathan Callan wasn’t just creating sculptures; he unveiled the hidden patterns of nature. His landscapes, formed by pouring cement through randomly drilled boards, weren’t mere artistic whimsy. They were tangible expression of complex mathematical principles and a window into the concept of self-organized criticality.

The intricate shapes that emerged from Callan's process were known as geometry of Voronoi cells.
These geometric structures, defined by the proximity of points to one another, can be found in diverse natural phenomena, from the patterns on a giraffe's skin, the distribution of territories in animal populations, galaxies that cluster together in a vast cosmic web, to the bubbly foam of your morning latte.
But what makes Callan's work truly remarkable is how it bridges the gap between art and science, revealing a profound link to self-organized criticality.
In Callan's sculptures, each hole in the board acts as a nucleation point, a catalyst for the cement's flow. As the cement spreads outward, it encounters the flow from other holes, creating boundaries and defining the irregular shapes of the Voronoi cells. This seemingly random process mirrors the dynamics of self-organized criticality, where seemingly unrelated events can trigger cascading effects of unpredictable magnitude.
Just as a single grain of sand can initiate an avalanche, a small change in the placement of a hole in Callan's boards can drastically alter the resulting landscape. The sculptures, therefore, become a physical embodiment of the delicate balance between order and chaos, a testament to the intricate interplay of forces that shape our world.
By capturing the essence of self-organized criticality in his art, Callan invited us to contemplate the profound interconnectedness of seemingly disparate phenomena. His sculptures were not just aesthetically pleasing objects; they were a testament to the hidden patterns that govern the universe, a reminder that even in the most seemingly random events, there lies a deeper order waiting to be discovered.
So, what's the takeaway from this wild ride through sand piles, stock markets, and cement sculptures?
Self-organized criticality is like the universe's own improv comedy show. It's a constant dance on the edge of chaos, where the next punchline – a market crash, a viral meme, an earthquake – is always a surprise.
But it's not just random silliness. There's a hidden structure, a pattern to the punchlines. The small jokes are frequent, the big ones are rare, but they're all part of the same show.
It's a humbling, even frightening realization. We can't control the punchlines, but we can learn to appreciate the humor in the chaos. We can build stronger sandcastles, more resilient companies, and a deeper understanding of the forces that shape our world.
So, the next time life throws you a curveball, remember Per Bak's sandpile. It's a reminder that even in the midst of chaos, there's a strange and beautiful order waiting to be discovered.
Dog-eared the following book upon repeated readings and journaled over several iterations to capture this narrative : How Nature Works: the science of self-organized criticality